Demographics of Poland
The Demographics of Poland is about the demographic features of the population of Poland, including population density, ethnicity, education level, health of the populace, economic status, religious affiliations and other aspects of the population.
According to the estimates of Polish Central Statistical Office (GUS), at the end of 2007 Poland had a population of 38,115,000, which translates into average population density of 122 people/km² (urban 1105 per 1 km², rural 50 per 1 km²). 61.5% of Polish population lives in the urban areas, a number which is slowly diminishing. Poland is the 33rd most populous country in the world (9th in Europe, with 5.4% of European population). Total population of Poland is decreasing (population growth was -0,04%). Average life expectancy was 70.5 for men and 78.9 for women. In 2009 it is expected to be 73.1 for men and 79.5 for women. Population distribution is uneven. From ethnic perspective, Poland is very homogeneous, with 96.7% of population being Polish.
A number of censuses have assessed this data, including a national census in 2002, and a survey by the Helsinki Foundation for Human Rights (HFHR), which confirmed there are numerous autochthonous ethnic groups in Poland. Estimates by INTEREG and Eurominority present a similar demographics picture of Poland but they provide estimates only for the most numerous of the autochthonous ethnic groups.
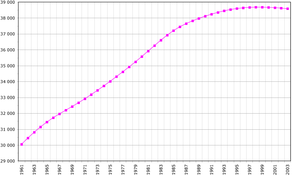
Historical population
For many centuries, until the end of Second World War, the Polish population was composed of many significant ethnic minorities. The population of Poland decreased due to the losses sustained during World War II, and became one of the most ethnically homogeneous in the world as a result of the radically altered borders after the war and the subsequent migrations. This homogeneity is a result of the post-World War II ethnic cleansing of the German population and deportations ordered by the Soviet authorities, who wished to remove the sizable Polish minorities from Lithuania, Belarus and Ukraine and deportations of Ukrainians from Poland.
Nationalities
96.7% of the people of Poland claim Polish nationality, and 97.8% declare that they speak Polish at home (Census 2002).
Largest metropolitan and urban areas
- Population numbers by database
| Area | ESPON [1] | Eurostat LUZ [2] | Ministry of Regional Development[3] | United Nations [4] | Demographia.com[5] | Citypopulation.de[6] | Scientific study by T. Markowski[7] | Scientific study by Swianiewicz, Klimska [8] |
|---|---|---|---|---|---|---|---|---|
| Katowice (Katowice urban area) | 3,029,000 [9](5,294,000) | 2,710,397 | 3,239,200 | 3,069,000 | 2,500,000 | 2,775,000 | 2,746,000 | 2,733,000 |
| Warsaw | 2,785,000 | 2,660,406 | 2,680,600 | 2,194,000 | 2,030,000 | 2,375,000 | 2,631,900 | 2,504,000 |
| Kraków | 1,236,000 | 1,264,322 | 1,227,200 | 818,000 | 700,000 | Not listed | 1,257,500 | 1,367,000 |
| Łódź | 1,165,000 | 1,163,516 | 1,061,600 | 974,000 | 950,000 | 1,060,000 | 1,178,000 | 1,129,000 |
| Gdańsk | 993,000 | 1,105,203 | 1,220,800 | 854,000 | 775,000 | No data | 1,098,400 | 1,210,000 |
| Poznań | 919,000 | 1,018,511 | 1,227,200 | No data | 600,000 | No data | 1,011,200 | 846,000 |
| Wrocław | 861,000 | 1,031,439 | 1,136,900 | No data | 600,000 | No data | 1,029,800 | 956,000 |
Demographics by town
| City | Voivodeship | Inhabitants May 20, 2002 |
Inhabitants December 31, 2004 |
Inhabitants December 31, 2006 |
|
|---|---|---|---|---|---|
| 1 | Warsaw | Masovia | 1,671,670 | 1,692,854 | 1,702,139 |
| 2 | Łódź | Łódź | 789,318 | 774,004 | 760,251 |
| 3 | Kraków | Lesser Poland | 758,544 | 757,430 | 756,267 |
| 4 | Wrocław | Lower Silesia | 640,367 | 636,268 | 634,630 |
| 5 | Poznań | Greater Poland | 578,886 | 570,778 | 564,951 |
| 6 | Gdańsk | Pomerania | 461,334 | 459,072 | 456,658 |
| 7 | Szczecin | Western Pomerania | 415,399 | 411,900 | 409,068 |
| 8 | Bydgoszcz | Kuyavia-Pomerania | 373,804 | 368,235 | 363,468 |
| 9 | Lublin | Lublin | 357,110 | 355,998 | 353,483 |
| 10 | Katowice | Silesia | 327,222 | 319,904 | 314,500 |
| 11 | Białystok | Podlaskie | 291,383 | 292,150 | 294,830 |
| 12 | Gdynia | Pomerania | 253,458 | 253,324 | 251,844 |
| 13 | Częstochowa | Silesia | 251,436 | 248,032 | 245,030 |
| 14 | Radom | Masovia | 229,699 | 227,613 | 225,810 |
| 15 | Sosnowiec | Silesia | 232,622 | 228,192 | 245,030 |
| 16 | Toruń | Kuyavia-Pomerania | 211,243 | 208,278 | 207,190 |
| 17 | Kielce | Świętokrzyskie | 212,429 | 209,455 | 207,188 |
| 18 | Gliwice | Silesia | 203,814 | 200,361 | 198,499 |
| 19 | Zabrze | Silesia | 195,293 | 192,546 | 190,110 |
| 20 | Bytom | Silesia | 193,546 | 189,535 | 186,540 |
| 21 | Bielsko-Biała | Silesia | 178,028 | 176,987 | 176,453 |
| 22 | Olsztyn | Warmia-Masuria | 173,102 | 174,550 | 174,941 |
| 23 | Rzeszów | Subcarpathia | 160,376 | 159,020 | 165,578 |
| 24 | Ruda Śląska | Silesia | 150,595 | 147,403 | 145,471 |
| 25 | Rybnik | Silesia | 142,731 | 141,755 | 141,388 |
| 26 | Tychy | Silesia | 132,816 | 131,547 | 130,492 |
| 27 | Dąbrowa Górnicza | Silesia | 132,236 | 130,789 | 129,559 |
| 28 | Opole | Opole | 129,946 | 128,864 | 127,602 |
| 29 | Płock | Masovia | 128,361 | 127,841 | 127,224 |
| 30 | Elbląg | Warmia-Masuria | 128,134 | 127,655 | 126,985 |
| 31 | Gorzów Wielkopolski | Lubusz | 125,914 | 125,578 | 125,504 |
| 32 | Wałbrzych | Lower Silesia | 130,268 | 127,566 | 124,988 |
| 33 | Włocławek | Kuyavia-Pomerania | 121,229 | 120,369 | 119,256 |
| 34 | Zielona Góra | Lubusz | 118,293 | 118,516 | 118,115 |
| 35 | Tarnów | Lesser Poland | 119,913 | 118,267 | 116,967 |
| 36 | Chorzów | Silesia | 117,430 | 115,241 | 113,978 |
| 37 | Kalisz | Greater Poland | 109,498 | 108,792 | 108,477 |
| 38 | Koszalin | Western Pomerania | 108,709 | 107,773 | 107,693 |
| 39 | Legnica | Lower Silesia | 107,100 | 106,143 | 105,186 |
| 40 | Grudziądz | Kuyavia-Pomerania | 99,943 | 98,757 | 99,244 |
| 41 | Słupsk | Pomerania | 100,376 | 99,827 | 98,092 |
Demographics by voivodeship
| Inhabitants of voivodeships (2008, according to GUS) |
|||
|---|---|---|---|
| Voivodeship | Area (in km²) |
Inhabitants | Pace of gain (%) |
| Lower Silesian | 19 947 | 2 887 059 | -0,04 |
| Kuyavian-Pomeranian | 17 972 | 2 067 918 | +0,07 |
| Lublin | 25 122 | 2 161 832 | -0,15 |
| Lubusz | 13 998 | 1 008 926 | 0,00 |
| Łódź | 18 219 | 2 548 861 | -0,20 |
| Lesser Poland | 15 183 | 3 287 136 | +0.22 |
| Masovian | 35 558 | 5 204 495 | +0,26 |
| Opole | 9412 | 1 033 040 | -0,31 |
| Subcarpathian | 17 846 | 2 099 495 | +0,03 |
| Podlaskie | 20 187 | 1 191 470 | -0,07 |
| Pomeranian | 18 310 | 2 219 512 | +0,32 |
| Silesian | 12 334 | 4 645 665 | -0.12 |
| Świętokrzyskie | 11 710 | 1 272 784 | -0,20 |
| Warmian-Masurian | 24 173 | 1 427 073 | +0,03 |
| Greater Poland | 29 827 | 3 397 617 | +0.26 |
| West Pomeranian | 22 892 | 1 692 957 | +0,04 |
| Poland | 312 679 | 38 135 876 | +0,05 |
Statistics
The following demographic statistics are from the CIA World Factbook, unless otherwise indicated.
Population
38,463,689 (July 2010 est.) - 34th country in comparison to the world.
Population growth rate
-0.053% (2009 est.)
Birth rate
10.04 births/1,000 population (2010 est.)
There were 389,000 births in 2007 compared to 374,244 in 2006.[10]
Death rate
10.1 deaths/1,000 population (July 2010 est.)
There were 372,000 deaths in 2007 compared to 369,000 in 2006. [10]
Net migration rate
-0.47 migrants/1,000 population (2010 est.)
Total asylum seekers admitted
10,590 (2009) applications, mostly from the Russian Federation,[11] Georgia, and Armenia[12]
Age structure
0–14 years: 14.8% (male 2,931,732/female 2,769,021)
15–64 years: 71.7% (male 13,725,939/female 13,863,103)
65 years and over: 13.5% (male 1,971,763/female 3,202,131) (2010 est.)
Sex ratio
at birth: 1.061 male(s)/female
under 15 years: 1.06 male(s)/female
15–64 years: 0.99 male(s)/female
65 years and over: 0.62 male(s)/female
total population: 0.94 male(s)/female (2010 est.)
Infant mortality rate
total: 6.66 deaths/1,000 live births
male: 7.38 deaths/1,000 live births
female: 5.9 deaths/1,000 live births (2010 est.)
Life expectancy at birth
total population: 75.85 years
male: 71.88 years
female: 80.06 years (2010 est.)
Total fertility rate
1.29 children born/woman (2010 est.). The 2008 est. was 1.39, with 1.30 for urban areas and 1.53 for rural areas. The 2008 total fertility rate of 1.39 is a significant improvement over 1.31 in 2007.[13]
Ethnic groups
Polish 96.7%, German 0.4%, Belarusian 0.1%, Ukrainian 0.1%, other and unspecified 2.7% (2002 census)
Religions
Roman Catholic 89.8% (about 75% practicing), Eastern Orthodox 1.3%, Protestant 0.3%, other 0.3%, unspecified 8.3% (2002 census)
Languages
Polish 97.8%, other and unspecified 2.2% (2002 census)
Literacy
definition: age 15 and over can read and write
total population: 99.8%
male: 99.8%
female: 99.7% (2003 est.)
Notes
- ↑ European Spatial Planning Observation Network, Study on Urban Functions (Project 1.4.3), Final Report, Chapter 3, (ESPON, 2007)
- ↑ Eurostat, Urban Audit database, accessed on 2009-03-12. Data for 2004.
- ↑ "Koncepcja przestrzennego zagospodarowania kraju" - Ministerstwo Rozwoju Regionalnego, 2003
- ↑ World Urbanization Prospects - United Nations - Department of Economic and Social Affairs / Population Division, The 2003 Revision (data of 2000)
- ↑ Demographia.com - World Urban Areas
- ↑ Thomas Brinkoff, Principal Agglomerations of the World, accessed on 2009-03-12. Data for 2009-01-01.
- ↑ Funkcje Metropolitalne Pięciu Stolic Województw Wschodnich
- ↑ "Społeczne i polityczne zróżnicowanie aglomeracji w Polsce" - Paweł Swianiewicz, Urszula Klimska; University of Warsaw 2005
- ↑ Data of polycentric Silesian metropolitan area
- ↑ 10.0 10.1 Euromonitor - Demographers hail Polish baby boom
- ↑ UNHRC "Central Europe: More Asylum Seekers, Less Refugees"
- ↑ UNHRC Asylum Trends 2007-2009
- ↑ [1]
See also
- Health in Poland
External links
- Central Statistical Office for the Republic of Poland
- Commonwealth of Diverse Cultures: Poland's Heritage
- CIA World Factbook 2004
- Helsinki Foundation for Human Rights
- Poland - Population and ethnic composition
- Armenians in Poland
- Poland's president expresses regret over 1947 Akcja Wisla
- INTEREG
|
||||||||||||||